This post includes plots of my weekly GitLab activity over the last year which update automatically three times a day. The data are pulled through GitLab API using a python script based on the requests library and authenticating with a personal access token. The JSON data returned by the HTTP request are then analysed, formatted for the plots and saved to a JSON file. A GitLab pipeline scheduled for every 8 hours runs the script and copies the data file over to EOS where this website is hosted.
The copy is done over the XRootD protocol with Kerberos authentication. Finally, the data are read with a simple JavaScript snippet feeding them into a Highcharts visualisation. I’ll go over each step in slightly more details below.
Getting the data
Interacting with GitLab API with python requests is as easy as:
headers = {'Content-Type': 'application/json'}
params = (
    ('after', date_start.strftime('%Y-%m-%d')),
    ('before', date_end.strftime('%Y-%m-%d')),
    ('per_page', '100'),
    ('private_token', token)
)
r = requests.get(url, headers=headers, params=params)
ret_list = r.json()
where date_start and date_end are datetime.date objects. There are a few extra lines of code required to handle
pagination, but in the end we get a list of JSON dictionaries with GitLab events. These can be opened Merge Requests,
comments, pushes, deleted branches, and others.
Formatting the data
Another few simple python functions can get us to summary data suitably formatted for Highcharts bar and line plots:
{
  "categories": ["2020w06","2020w07","2020w08","2020w09","2020w10","2020w11","2020w12","2020w13","2020w14","2020w15"],
  "series": [
    {
      "name": "Opened MRs",
      "data": [3,7,5,4,8,7,6,5,2,6]
    },
    {
      "name": "Pushes",
      "data": [5,15,17,11,16,26,21,17,12,11]
    },
    {
      "name": "Comments",
      "data": [5,22,11,6,16,27,61,8,17,16]
    }
  ]
}
Reading the data into a Highcharts plot
The above data can be saved into a JSON file and then read with JavaScript directly into the webpage. The simplest way
to do this without reinventing the wheel is jQuery.getJSON(). The Highcharts
code is then best chained into the .done() callback. The script loaded in this page has the following format:
document.addEventListener('DOMContentLoaded', function () {
  $.getJSON('/rbielski/chart-data/plot_data.json').done(function (data) {
    // define Highcharts plots here
  }
}
where data['categories'] is passed into the charts x-axis categories parameter and data['series'] is passed to the
charts series parameter. There are numerous examples of chart definitions in Highcharts
documentation and demos. The line chart seen above
is defined as follows:
var myChart2 = Highcharts.chart('container2', {
  chart: {type: 'line'},
  title: {text: 'GitLab weekly activity @rbielski'},
  subtitle: {text: 'https://gitlab.cern.ch/rbielski'},
  xAxis: {categories: data['categories']},
  yAxis: {
    min: 0,
    title: {text: 'Number'}
  },
  plotOptions: {
    line: {
      dataLabels: {enabled: true}
    }
  },
  series: data['series'],
  colors: ['#83c8ff', '#d9c2f3', '#00b2a0']
};
The only thing needed to insert the chart into HTML then is to define a div with id equal to the parameter passed
in chart's first argument:
<div id="container2" style="width:100%; height:400px;"></div>
Automatising data generation with GitLab Pipelines
The data loading and processing is wrapped into a single python script writing a JSON file in the above format. To avoid repeated calls to GitLab API for the same historical data, I actually produce two JSON files. One is the output suitable for Highcharts, the other is a “raw” buffer of all GitLab Events for each week which serves also as an input to the script. If data for a given week in the past is already in the buffer, it is not requested again from GitLab. Only the missing and current week data are requested.
The page is already being deployed via GitLab Pipelines on push to the master branch of my repository. I plan to write
a separate post about this on day. To automatise the plot data generation, I added another step in my .gitlab-ci.yml:
gen-chart-data:
  stage: build-page
  only:
    - schedules
  image: $CI_REGISTRY_IMAGE:cc7-deploy
  script:
    - mkdir chart-data
    - cd chart-data
    - "#kinit step, not shown here for security reasons"
    - xrdcp --force "root://eosuser.cern.ch/$EOS_PATH/www/chart-data/*.json" . || echo
    - ../gitlab-api/api.py
  artifacts:
    paths:
      - chart-data
which runs only for schedules, and never for pipelines triggered by a push. It copies the “buffer” data file from the
host and runs the python script which reads it. I also added the copy of the chart-data directory into my
“deployment” step which now runs for both push-triggered and scheduled pipelines:
deployment:
  stage: deploy
  image: $CI_REGISTRY_IMAGE:cc7-deploy
  only:
    - master
  script:
    - "#kinit step, not shown here for security reasons"
    - if [ -d "www" ]; then xrdcp --force --recursive www "root://eosuser.cern.ch/$EOS_PATH/."; fi
    - if [ -d "chart-data" ]; then xrdcp --force --recursive "chart-data" "root://eosuser.cern.ch/$EOS_PATH/www/."; fi
This simply copies the data to the EOS directory where the webpage is hosted.
The last step is to create a schedule like in this screenshot:
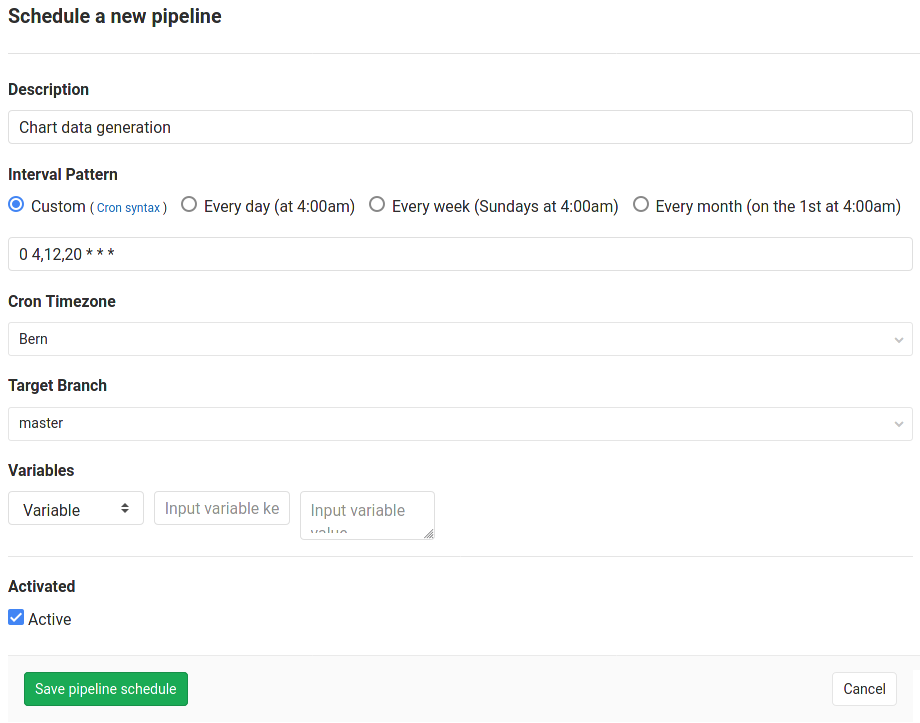
And we have it running - GitLab activity charts self-updating every 8h!